Level
Entry-Level
Prerequisites
Basic skills in data analysis including spreadsheets and descriptive statistics including: Measures of center (Mean, median, and mode) Measures of spread (Variance and standard deviation) Distributions (normal distribution, skewness) Analyzing data in spreadsheets like Excel or Google Sheets
Course Duration
4 months
Udacity current price ( USD)
1356
Career Focus
This program is intended to supplement existing skills and is not meant to prepare you for a specific role. However, the skills you gain are appropriate for many fields including business, marketing, data analytics, executive leadership, and more.
Target Audience
This program is intended for two types of students: business leaders and data professionals.
If you are a business leader looking to leverage data to communicate more effectively, this program is for you. You’ll be able to make your case for a business goal using data to tell a story.
If you are a data analyst, data scientist, machine learning engineer, or other data professional, this program will help you communicate your findings more effectively. You’ll be able to influence your business by showcasing and communicating the most important pieces of data.
General Curriculum)
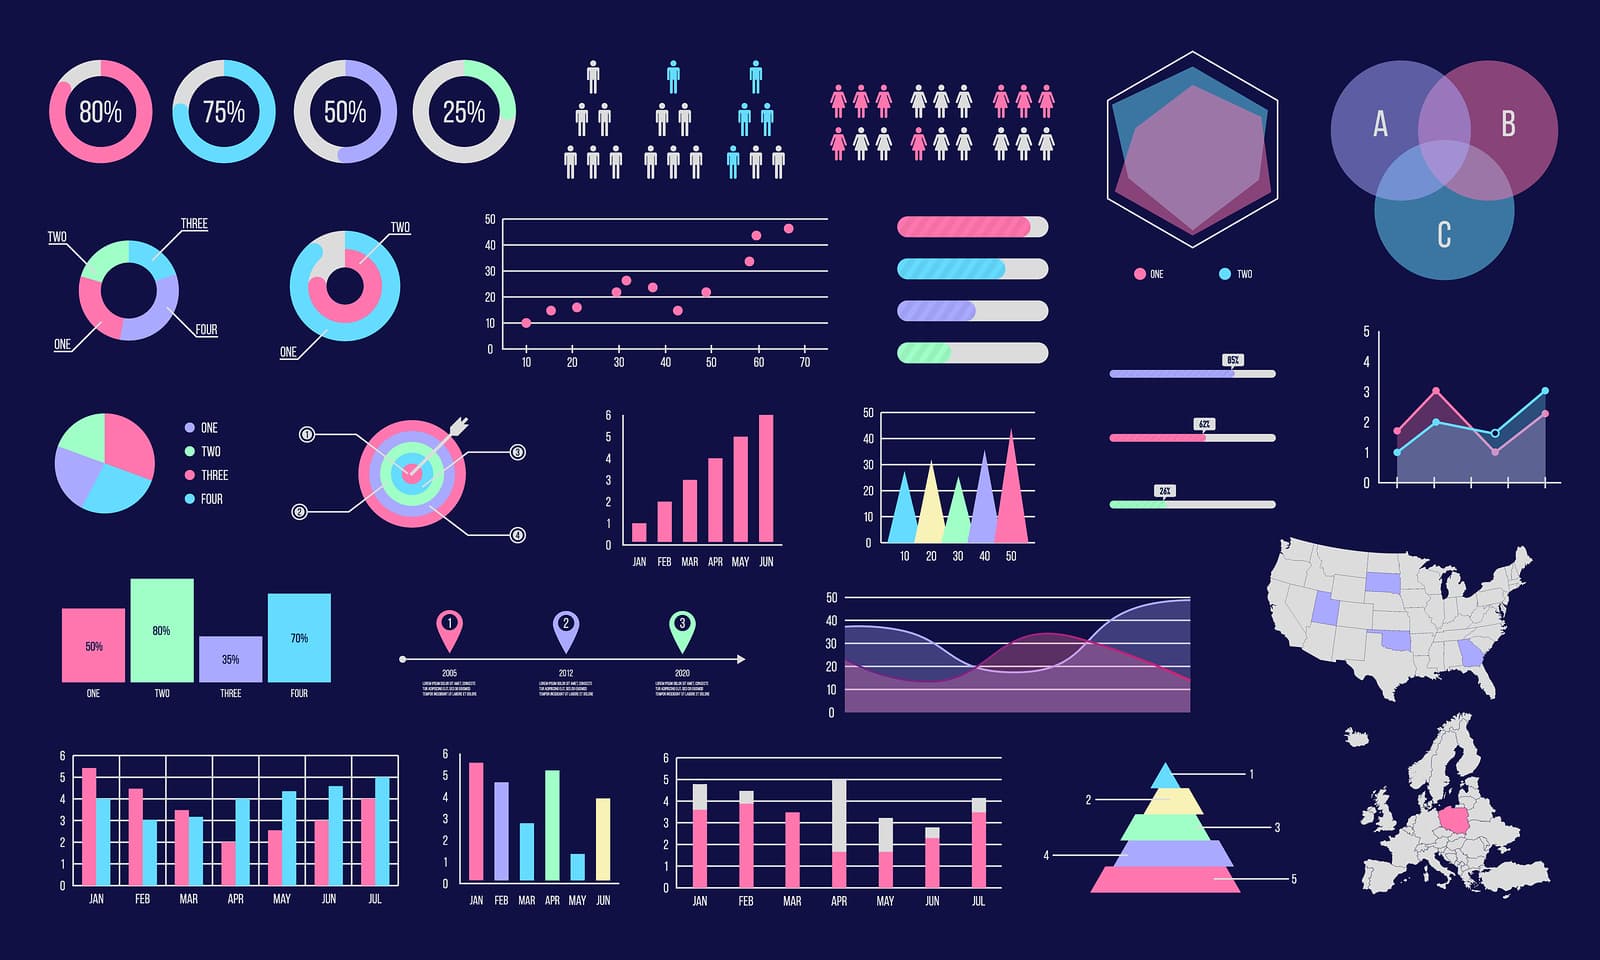
Students will start by building data visualizations and dashboards, considering your audiences to be as effective as possible. Then, they will move into drafting presentations using storytelling techniques, visualizations, and animations to provide data-driven recommendations.
Skill Covered
N/A
Tools
What They Need: Computer that can install/run the below programs
What They Will Use/Learn: Tableau
Projects
• Build Data Dashboards
• Design a Data Dashboard
• Build a Data Story
• Animate a Data Story
Syllabus
Resources (blog posts, other)
Course Features
- Lectures 0
- Quizzes 0
- Duration 3 months
- Skill level All levels
- Students 0
- Assessments Yes

